

Census Data
Determining areas for employment assistance programs in Connecticut
Problem and Objective
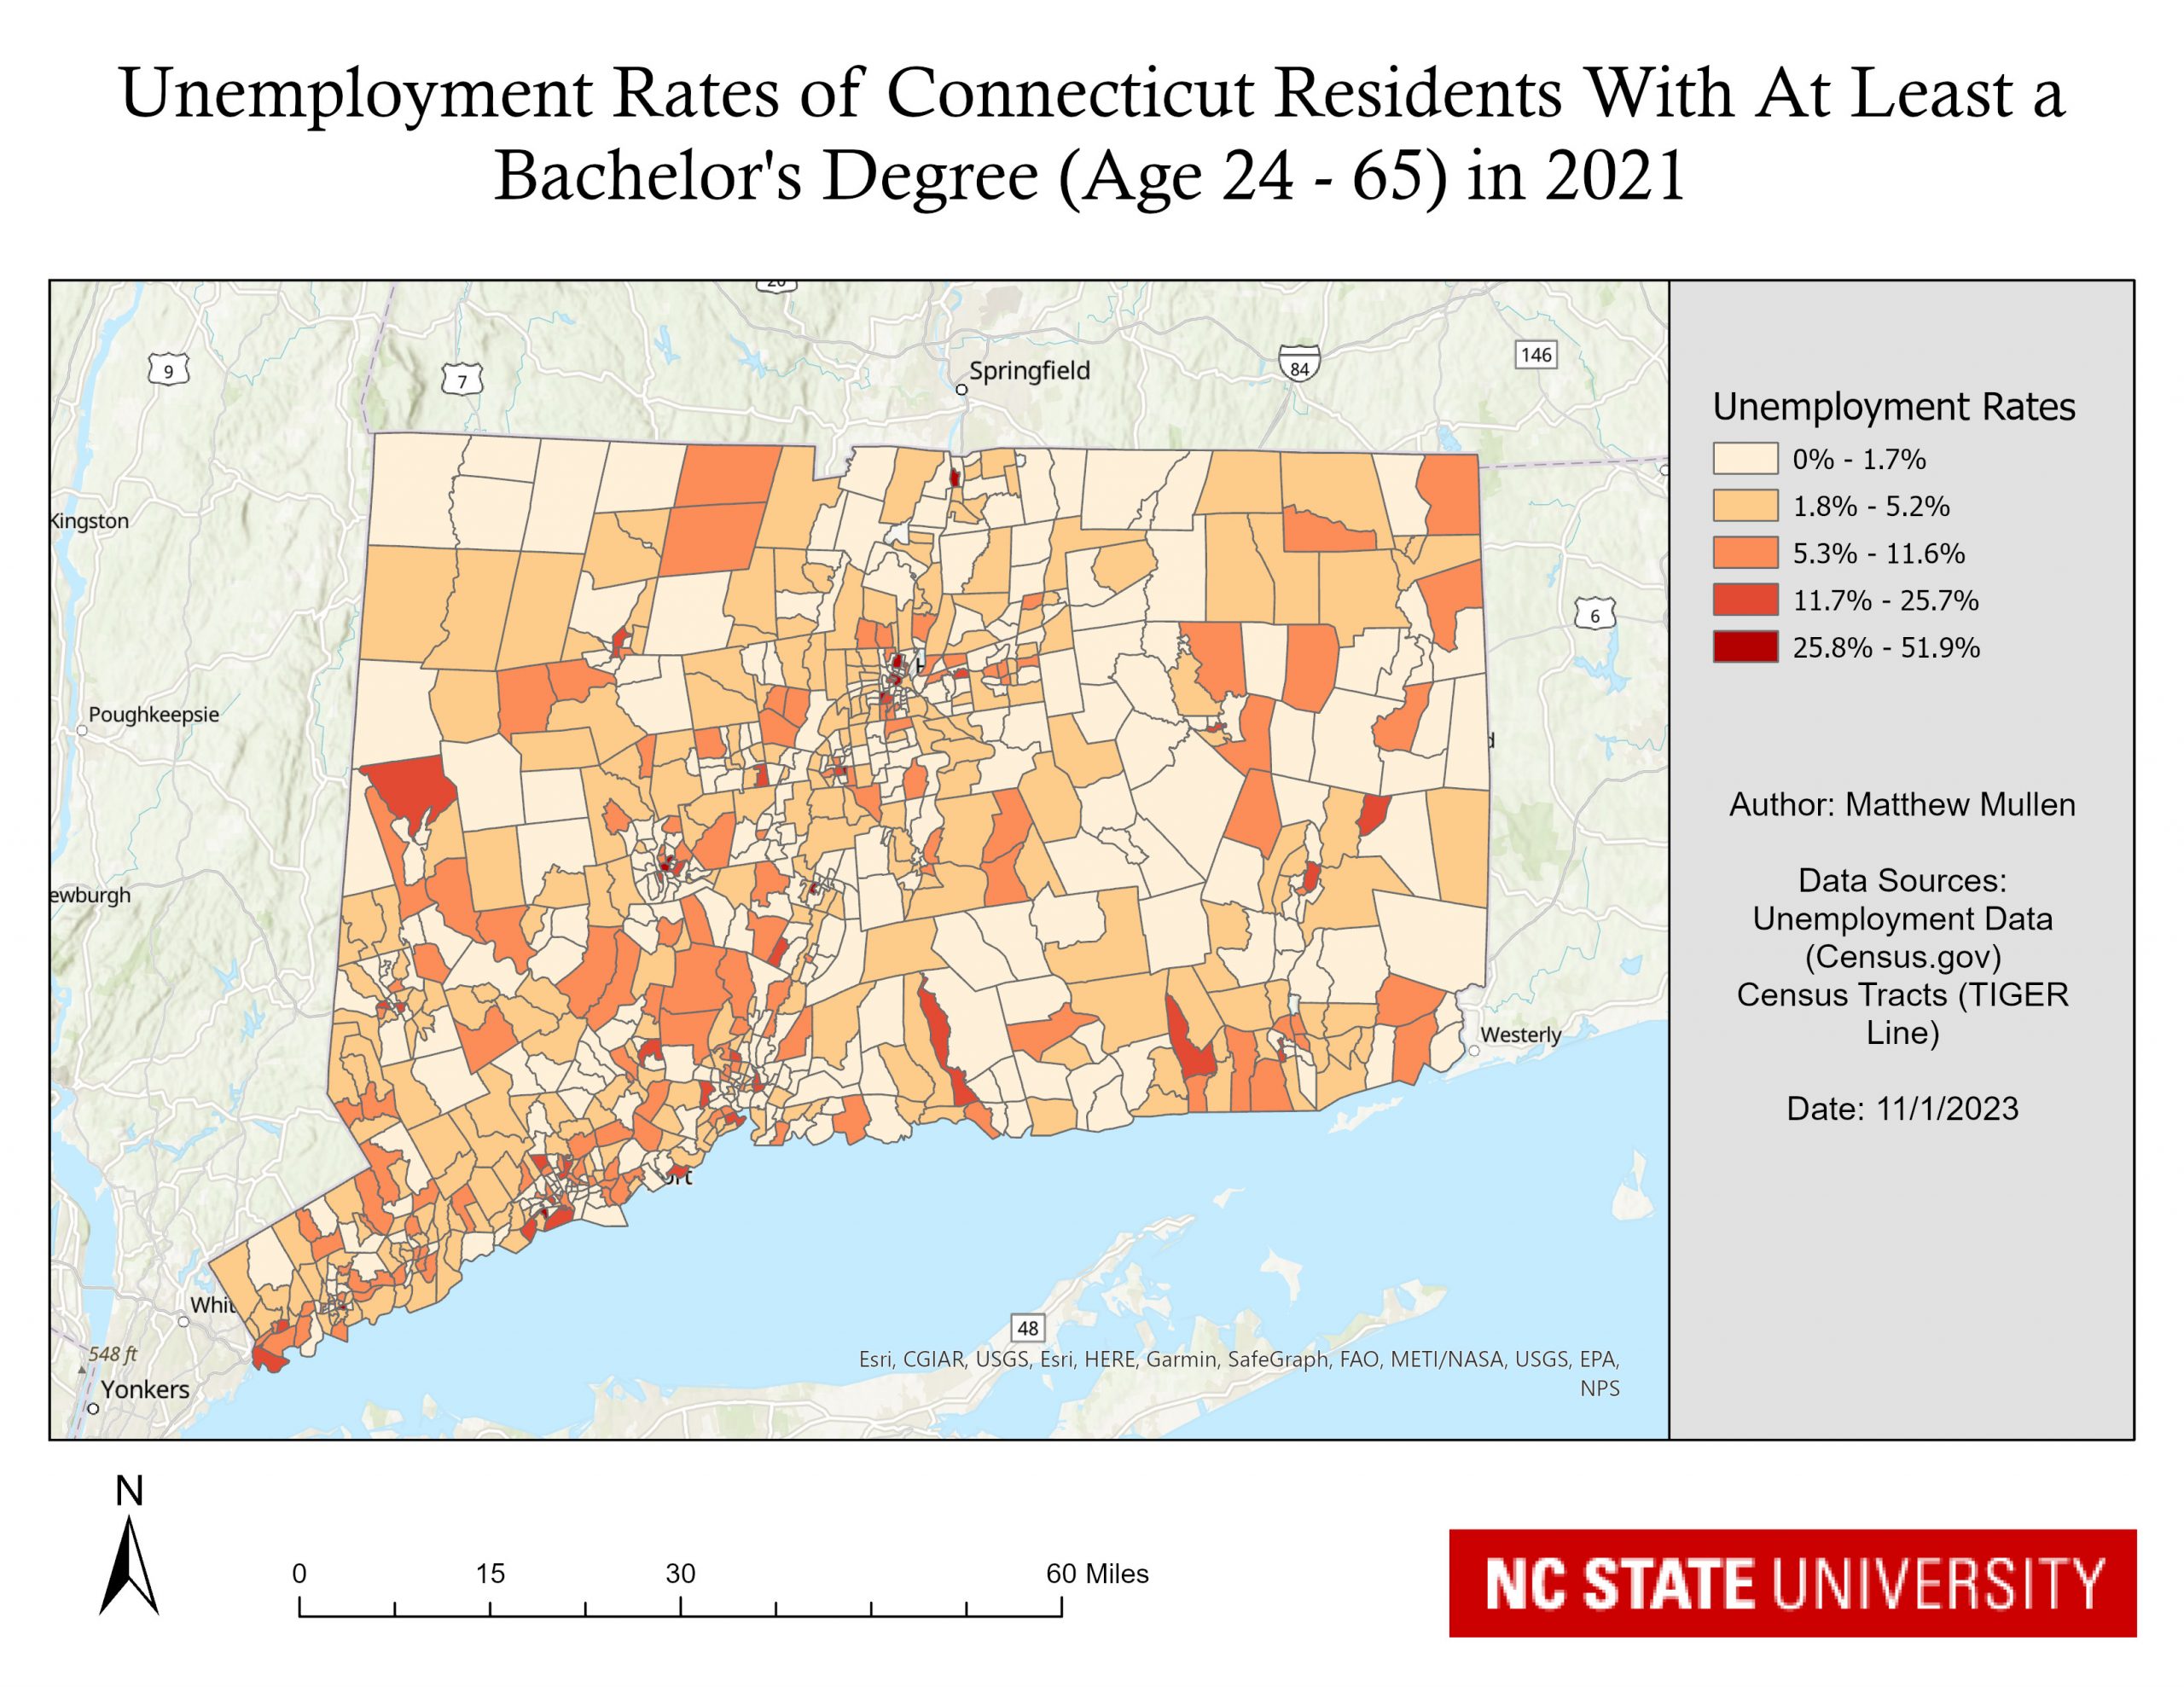
Decision makers in Connecticut are seeking to expand their employment assistance programs. To ensure that these programs are most heavily represented in the areas that are in the most need, a GIS analyst will be using data from the 2021 U.S. Census to determine areas that currently have the highest level of unemployment. For this particular analysis, we will be looking at those who currently have at least a Bachelor’s degree, are between the ages of 24 – 65 and that are currently unemployed. Global statistics will also be used to determine if there is significant clustering of areas with higher unemployment.
Analysis Procedures
To address this problem, I used ESRIs ArcGIS Pro 3.1 and tools from the Spatial Analysis toolbox including Calculate Distance Band from Neighbor Count and High/Low Clustering (Getis-Ord General G). Excel to Table and Add Join was used to visualize the census data. Data sets included Employment Statistics from Census.gov for Connecticut by Census Tracts as well as Census Tract geography data as a TIGER / Line Shapefile.
The name of the table I used for the employment statistics was ACSST5Y2021.S2301-Data and the field name used for mapping was S2301_C04_035E. The field name in the meta data was:
Estimate!!Unemployment rate!!EDUCATION ATTAINMENT!!Population 25 to 64 years!!Bachelor’s degree or higher
Fields of interest within the census data can be visualized by joining the attribute data to the geography shapefiles. To do this, I first added the census tracts for the state of Connecticut to the map. I then changed the projection of these census tracts to NAD 1983 HARN StatePlane Connecticut FIPS 0600 using the Project tool, and then changed the projection of the map to the same projection. I next looked at the Excel file with Census data and found the field of interest and recorded the name. I deleted the second header row in the table so it would import properly into ArcGIS. I then ran the Excel to Table tool to import the data into my project.
The field of interest was imported as a text field due to some rows which had the “-“ character as data. To fix this so I could symbolize the data properly, I created a new column of type “Float” and populated this column with the data from field of interest, using Python. Next, I created a new field to populate the proper GEOID, as the GEOID field of the Census Data had extraneous characters that were not needed. Again I used a Python expression to slice off the last 11 digits and populate them into my new field. I then added a Join with the Connecticut Census Tracts data on the GEOID column. I then symbolized the Unemployment Data using Graduated Colors.
To calculate global statistics, I first used the Calculate Distance Band from Neighbor Count, using 7 neighbors as the input. I found the average neighbor distance of 15,904 feet, and used that calculation to run the High/Low Clustering tool at 5 different fixed band distance intervals, in increments of 1,000 feet.

Results
Application & Reflection
Census data covers multiple aspects of people’s lives and habits, and it can be utilized in many different types of projects.
Problem description
I have been tasked with finding the percentage of housing units that are utilizing solar energy within Denver County, Colorado in 2012 and compare that with data from 2022 to see if the usage of solar energy is increasing.
Data needed
Tabular data from the US Census for both 2012 and 2022 for Physical Characteristics of Homes. The census tract shapefile for Denver County.
Analysis procedures
I will take the census data from one year and look at the meta data, finding the correct field that I want to focus on. This field is Percent!!HOUSE HEATING FUEL!!Occupied housing units!!Solar energy. I will import both Excel files into ArcMap, and ensure that this field is imported as numeric. If not, I will create a new field of type Float and populate it with the new data. I will join these two tables (one for each year) and create a new field where I will subtract the 2022 value from the 2012 value, creating a percentage change field from 2012 to 2022.
I will then perform a join between this data and the census tracts for Denver County. Then I will symbolize the percentage change by graduated colors to create a map showing percentage increase or decrease in solar energy use from 2012 to 2022 in Denver County.