

Suitability Analysis and Weighted Overlay
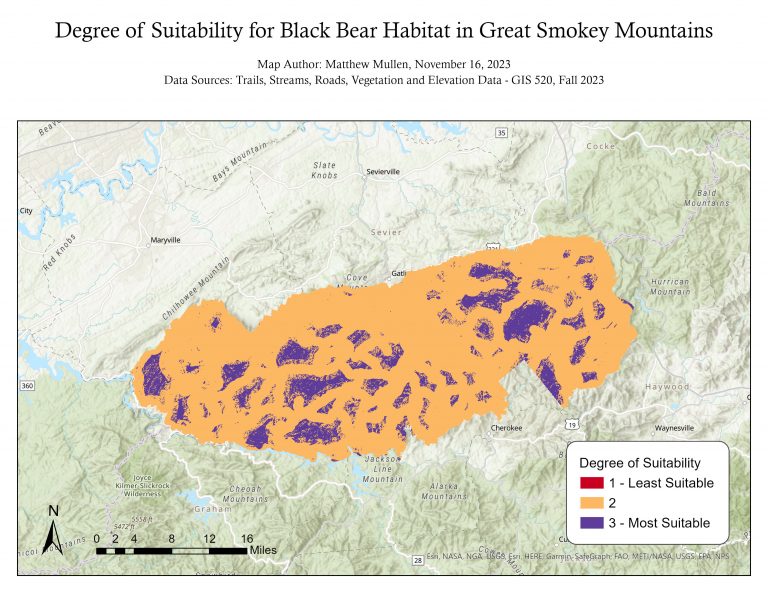
Identifying suitable locations to relocate black bears in Great Smokey Mountains National Park
Problem and Objective
Biologists at Great Smokey Mountains National Park have been having issues with black bears getting too close to park visitors. These issues are often occurring near roads and trails throughout the park where visitors and bears have a higher chance of interaction. Officials at the National Park Service would like to know if there are suitable locations in the park where they can safely relocate black bears that provide them the resources they need while also being at a safe distance from visitors. To accomplish this, we have been asked to create a weighted overlay using multiple inputs and produce a map showing the most suitable areas to potentially relocate black bears.
Analysis Procedures
To address this problem, I used ESRIs ArcGIS Pro 3.1 and various tools from the Spatial Analysis toolbox including Distance Accumulation, Reclassify, Slope and Weighted Overlay. The data used for this analysis included line shapefiles of roads, streams and trails in the area, a polygon shapefile of vegetation types within the park, and a raster dataset of elevation. This data was provided by our GIS 520 course.
We have been provided by biologists at the park with factors and criteria to determine the suitability of land for black bear habitat. These criteria have been organized into categories of least suitable, favorable and most suitable. To create this weighted overlay, I first set the environment variables within ArcGIS Pro. I set the processing extent to the “vegetation” polygon layer and set the raster cell size to the elevation data. I next created a new toolbox and created a new model within the toolbox.
Next I added the roads shapefile to the model, and added the Distance Accumulation tool in order to calculate the distance away from roads. I then repeated the same process for the streams and trails shapefiles. Next I added the vegetation type shapefile to the model, and added the Feature to Raster tool as rasters are needed for weighted overlay. I then added the elevation data to the model and used the Slope tool to calculate slope.
After deriving the data from the original files using the procedures described above, I then added the Reclassify tool to each resultant raster in the model. Each raster was reclassified based on the criteria we received from the biologists, with 1 representing the least suitable criteria and 3 the most suitable. After reclassification, each of the resultant rasters were used at inputs to the Weighted Overlay tool. The resulting raster was then mapped and exported for viewing.

Results
Application & Reflection
Creating suitability analyses are extremely important in the GIS world and help companies, land managers, agriculturists and more determine where to put a feature of interest that will meet their specified criteria.
Problem description
I am working on a project that is trying to determine the best place to put a new grocery store. I need to determine where the most suitable location is, taking into account population data, neighborhood demographics, visibility, and other competing stores in the area.
Data needed
Demographic information and population in areas which can be obtained from the US Census, information on roads to determine visibility from the NCDOT, and information on locations of other competing grocery stores.
Analysis procedures
I will first derive the distance from roads and other grocery stores using the Distance Accumulation tool. I will then select for the neighborhood demographics that I am targeting. Next I will use the Reclassify tool on each layer, assigning suitability scores to certain population ranges and demographics that I am targeting, as well as assigning suitability scores to certain distances from roads and other grocery stores. Finally I will input these reclassified raster layers in the Weighted Overlay tool, creating a final map of suitability scores for a new grocery store.